


Revealing OTDR Tips and Tricks: Comprehensive Operation Guide

Before you commence: Determine if an OTDR is suitable for testing your cable plant.
Initially designed for testing and diagnosing long-haul networks, the latest generation of OTDRs tailored for Fiber to the Home (FTTH) and Local Area Networks (LANs) can effectively test shorter networks. If you need help determining whether your OTDR is designed for shorter networks, consult the OTDR manual or reach out to the applications support department of the OTDR manufacturer. This ensures you save time attempting to test a network that is too short for OTDR testing.
For additional information on OTDR testing, refer to What is OTDR and how does it work?
How to Use OTDR?
Before starting the test, this section will introduce some OTDR parameters and how to perform OTDR testing.
Optical fiber measurement using an OTDR involves a three-step process: parameter configuration, data acquisition, and curve analysis. The manual configuration of measurement parameters encompasses the following:
Wavelength Selection (λ)
The choice of wavelength is critical since different wavelengths correspond to distinct light characteristics (e.g., attenuation, micro-bending). The test wavelength typically aligns with the transmission and communication wavelength of the system. For instance, if the system operates at a wavelength of 1550, the test wavelength is set to 1550nm.
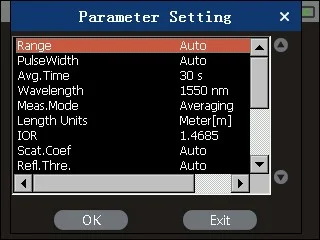
Pulse Width
The pulse width influences the dynamic measurement range and distance. An extended pulse width results in a more extensive dynamic range and coverage distance. However, this also leads to a larger blind area in the OTDR curve waveform. The pulse width period is typically represented in nanoseconds (ns).
Range
The OTDR measurement range defines the maximum distance for data sampling. The selection of this parameter determines the size of the sampling resolution. Ideally, the measurement range should be 1.5 to 2 times the optical fiber's length.
Average Time
Due to the weak backscattered light signal, the statistical averaging method is commonly used to enhance the Signal-to-Noise Ratio (SNR). Longer average times result in higher SNR. For example, an increase in dynamics of 0.8dB can be achieved with an average time of 3 minutes compared to 1 minute. However, an acquisition time exceeding 10 minutes does not significantly improve the SNR. Generally, the average time is 3 minutes at maximum.
Optical Fiber Parameters
The setting of optical fiber parameters includes configuring the refractive index, backscattering coefficient, and backscattering coefficient η. The refractive index parameter is related to distance measurement, and the backscattering coefficient affects reflection and return loss measurement results. The optical fiber manufacturer typically provides these parameters.
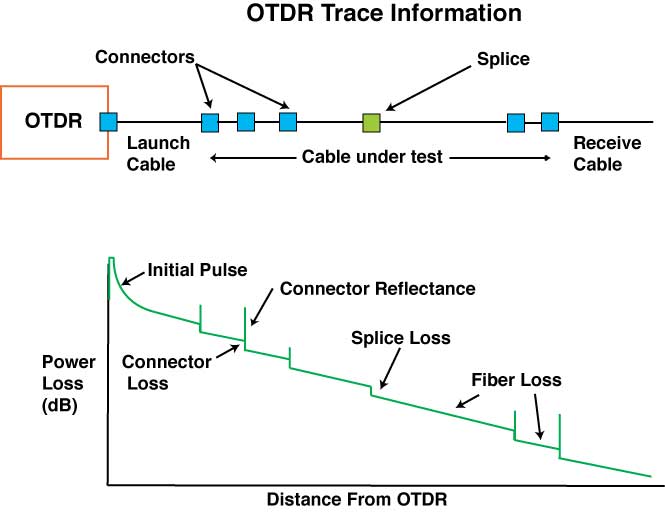
Once the parameters are set, the OTDR can transmit optical pulses, receive light scattered and reflected by the fiber link, and sample the output of the photodetector to generate the OTDR curve. Analyzing the curve provides insights into the quality of the fiber.
How to Analyze OTDR Testing?
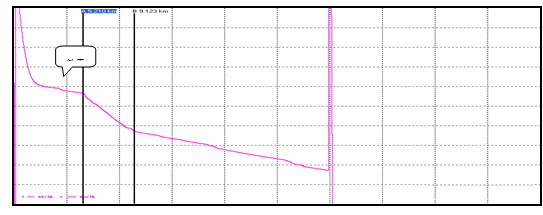
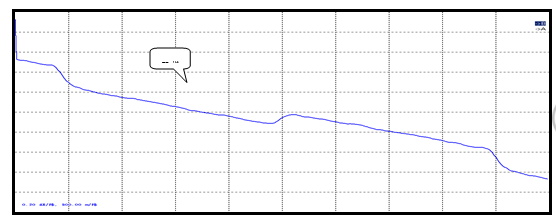
Normal curve
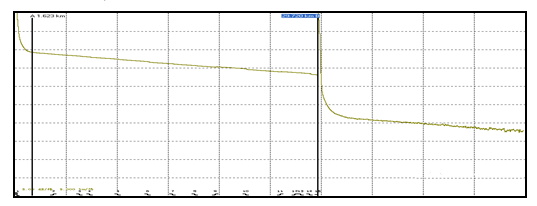
As the figure shows, assessing the curve's normality involves examining its main body's consistent slope. A small slope suggests a low line attenuation constant, indicating good attenuation homogeneity.
The attenuation coefficients of B1.1 and B4 single-mode fibers should align with the values specified in the following table.
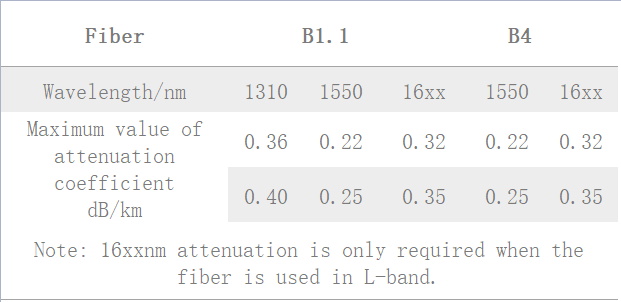
For B1.1 single-mode fiber, a continuous fiber length at 1310nm wavelength should not surpass a 0.1dB discontinuity point, while at 1550nm wavelength, it should not exceed a 0.05dB discontinuity point. As for B4 single-mode fiber, at a wavelength of 1550nm, the continuous fiber length should not surpass a 0.05dB discontinuity point.
Abnormal curve
Large Steps Curve
As the figure shows, distinct "steps" are evident. If this corresponds to a joint, it suggests the joint is unqualified or the fiber is excessively small or extruded within the bending radius of the fusion tray. If it's not a joint, it indicates the cable is either extruded or sharply bent.
Large Slope Curve
As the figure shows, the slope of this curve segment is notably higher, signifying poor quality in this particular section of the fiber, with a corresponding increase in attenuation.
Non-reflective Break at the Far End of the Curve
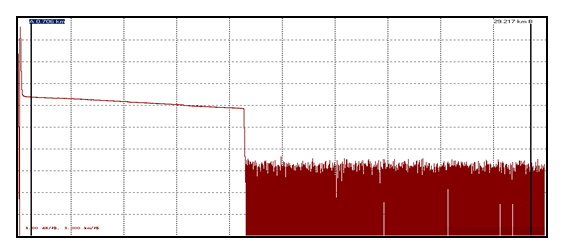
As the figure shows, No reflection break is observed after this curve, indicating either poor quality at the distal end of the fiber or a break in the fiber.
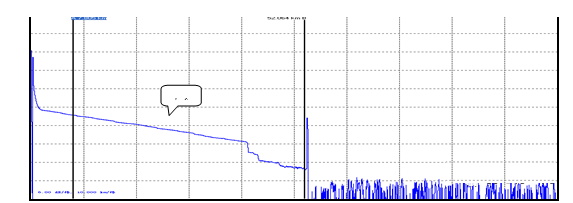
Phantom Peaks (Ghosts)
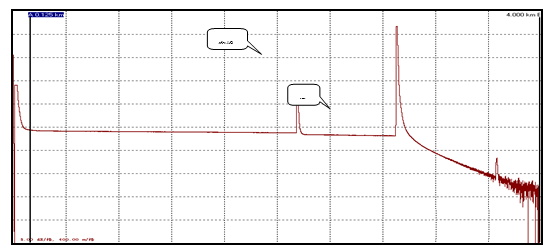
Figure 1: How to Identify Phantom Peaks(Ghosts)
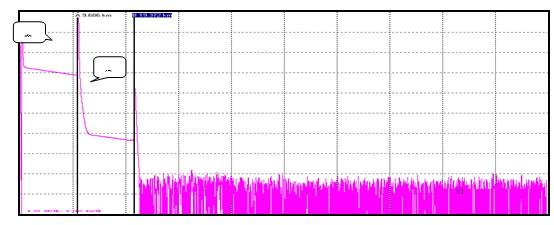
Figure 2: Removal of Phantom Peaks(Ghosts)
Detection of phantom peaks (ghosts): The ghosts on the curve do not result in a noticeable loss (refer to Figure 1); the spacing between the ghost and the curve's starting point is a multiple of the distance between the intense reflection event and the beginning, creating symmetry (see Figure 2).
Removal of phantom peaks (ghosts): Opt for shorter pulse widths and introduce attenuation at the highly reflective front end (e.g., OTDR output). If the source of ghosting is situated at the fiber's end, a slight bend can be applied to attenuate the light reflected to the starting point.
Gainer Processing
A gain may appear on the OTDR curve, as shown in Figure. Positive gain occurs when the fiber after the fusion point generates more backward scattered light than the fiber before the fusion point.
In reality, the fiber experiences fusion loss at this fusion point. This phenomenon is common when fusing fibers with varying mode field diameters or backscatter coefficients. Therefore, conducting measurements in both directions and averaging the results is essential to determine this fusion loss. The average splice loss is ≤ 0.08 dB in practical fiber optic cable maintenance.
Applications of OTDR Measurements
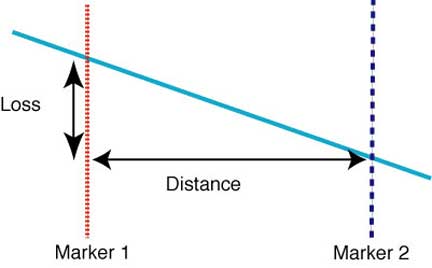
Distance Measurement With The OTDR
Position one of the markers on the OTDR (typically referred to as Marker A) just before the reflectance peak arising from the link between the launch cable and the test cable.
Position the second marker (typically referred to as Marker B) just before the reflectance peak arising from the connection between the cable under test and the receiving cable. In cases where no receiving cable is employed, a reflectance peak from the final connector on the cable under test should remain observable.
The OTDR will automatically calculate the length of the segment between the markers.
Measurement Uncertainty:
The OTDR calculates the length of the fiber by considering the index of refraction of the glass within the fiber. If you have the precise value for the index of refraction, input it into the OTDR setup.
The OTDR measures the fiber length, not the cable. Typically, the fiber is 1-2% longer than the cable, so it's essential to account for this difference when testing a substantial cable length.
Fiber Attenuation Coefficient Measurement
Position one of the markers on the OTDR (typically referred to as Marker 1 or A) on the specific fiber segment to be tested, keeping it away from any splices or connections in the cable under examination.
Place the second marker typically referred to as Marker 2 or B) further along the same segment, away from the OTDR.
The OTDR will then calculate the segment's loss between the markers, provide the distance, and display the results in dB/km.
Reducing Measurement Uncertainty:
Ensure that the markers are not positioned on curved sections of the trace, as this can lead to inaccurate readings.
Splice or Connector Loss Measurement
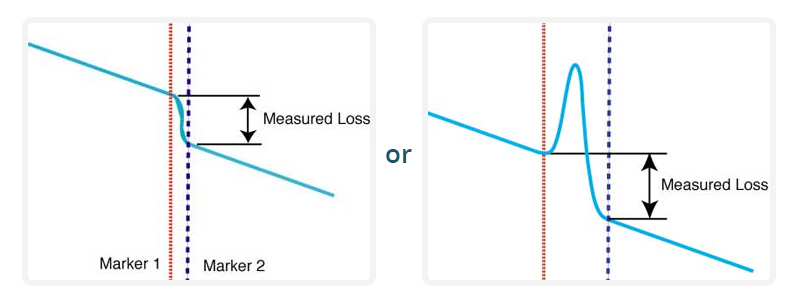
Position one of the markers on the OTDR (typically referred to as Marker 1 or A) just before the splice or the reflectance peak originating from the connection in the cable under test.
Position the second marker (typically referred to as Marker 2 or B) immediately following the splice or the reflectance peak originating from the connection in the cable under test.
The OTDR will then calculate the loss of the segment between the markers.
Reducing Measurement Uncertainty:
Ensure that the markers are not situated on curved sections of the trace, as this can lead to inaccurate readings.
The loss incurred by the fiber within the distance separating the markers will contribute to the overall measured loss. To mitigate this, employ the "least squares" method for loss. Refer to your OTDR manual for detailed instructions.
Reflectance Measurement
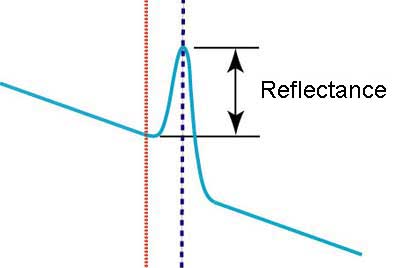
Position one of the markers on the OTDR (typically referred to as Marker 1 or A) just before the reflectance peak originating from the connection in the cable under test.
Place the second marker (typically referred to as Marker 2 or B) at the reflectance peak from the cable's connection under test.
The OTDR will then calculate the reflectance of the selected peak based on the markers.
Reducing Measurement Uncertainty:
Ensure that the markers are not positioned on curved sections of the trace, as this can lead to inaccurate readings.
OTDR Testing Tips
Simplified Assessment of Optical Fiber Quality
Typically, the slope of the primary section in the OTDR-tested optical curve (whether a single cable or multiple cables) remains consistent. A notable increase in slope in a specific area signifies higher attenuation in that segment. If the curve's main body exhibits irregularities, significant slope fluctuations, bending, or arc shapes, it indicates severe fiber degradation, falling short of communication requirements.
Wavelength Selection and Single/dual-direction Testing
The 1550nm wavelength offers longer measurement distances and is more sensitive to bending compared to 1310nm. The unit length attenuation at 1550nm is higher than at 1310nm, whereas welding or connector loss is higher at 1310nm than at 1550nm. In practical cable maintenance, both wavelengths are typically tested and compared. Analyzing and calculating phenomena such as positive gain and over-distance lines must be done in both directions to derive a reliable test conclusion.
Connector Preparation
Thorough cleaning is imperative before connecting the live optical fiber connector to the OTDR test device. This includes cleaning the output connector of the OTDR and the live connector being measured. Neglecting this step can result in excessive insertion loss, rendering the measurement unreliable, introducing noise to the curve, and potentially causing damage to the OTDR. It's crucial to use cleaning agents like alcohol, as other solutions may dissolve the adhesive inside the fiber connector.


share

